So let's say you've got an audience on social media and your website is generating consistent traffic. If you're looking at your overview statistics for your social media following and site visitors, that's a good start – and if you're regularly publishing content, you may see what looks like healthy engagement and growth.
But without qualitatively assessing analytics data, it can be difficult to see where an apparent increase of user interactions translates into tangible, purposeful exchanges with your audience. And, perhaps more importantly, an overview doesn't give you the details to determine when and how are your people are taking action, as opposed to just leaving a like.
When it comes to understanding the true impact of your content strategy, surface-level metrics like page views, likes, and impressions only tell part of the story. These numbers can definitely give you a sense of visibility, but they don't always correlate to meaningful interactions or conversions. To move beyond what some call "vanity metrics," focus on indicators of deep engagement and user intent – the markers that reveal when your audience is genuinely connecting with your content and motivated to take action.
Deep engagement is about understanding not just what people are doing, but why they are doing it. Are they simply scrolling past your post, or are they pausing to interact in a way that shows genuine interest? Are they landing on your website by accident, or are they actively seeking out your content to solve a problem or fulfill a need? By identifying metrics that signal intentional and purposeful interaction, you can refine your strategy and cultivate an audience that truly values what you offer.
Social media engagement often gets reduced to likes and reach, but these interactions may not always reflect genuine interest. To measure deeper engagement, prioritize metrics that indicate active participation and intent, such as:
By focusing on these metrics, you can gauge the depth of your audience's interest and identify opportunities to strengthen the connection.
When evaluating your website performance, the goal is not just to drive traffic but to create an experience that encourages users to stay, explore, and take meaningful actions. Some key metrics to watch include:
Focus on optimizing the journey your audience takes from landing on your site to achieving their goals, and yours.
Examples and screenshots are a product of content analysis and strategy for South Yuba River Citizens League (SYRCL), a non-profit in Nevada County, CA, June 2023 – September 2023.
SYRCL's analytics revealed plenty of likes on social media, but not a lot of user follow-through to take action. Within SYRCL's active audience, subscribers and site visitors came to the site via email newsletters, directly or organically via search engines and spent time reading articles.
As a nonprofit that regularly publishes informational and educational articles, they were in a perfect position to more strategically harness their news updates and long-form content. I redesigned a content strategy for SYRCL's social media to function as an extension of their articles, posting bite-sized snippets that delivered value directly to users in their feeds and encouraged them to learn more. Then, arriving on the website, these "warm leads" were much more likely to receive value from the long-form articles and take an action. We also incorporated data from qualitative user surveys and a previous period of user analytics to more directly tailor content towards proven audience preferences.
Tying in SYRCL’s messaging from end-to-end created consistency and clarity, along with added visibility. From any point in the path, users were directed inwards towards more content and experiences.
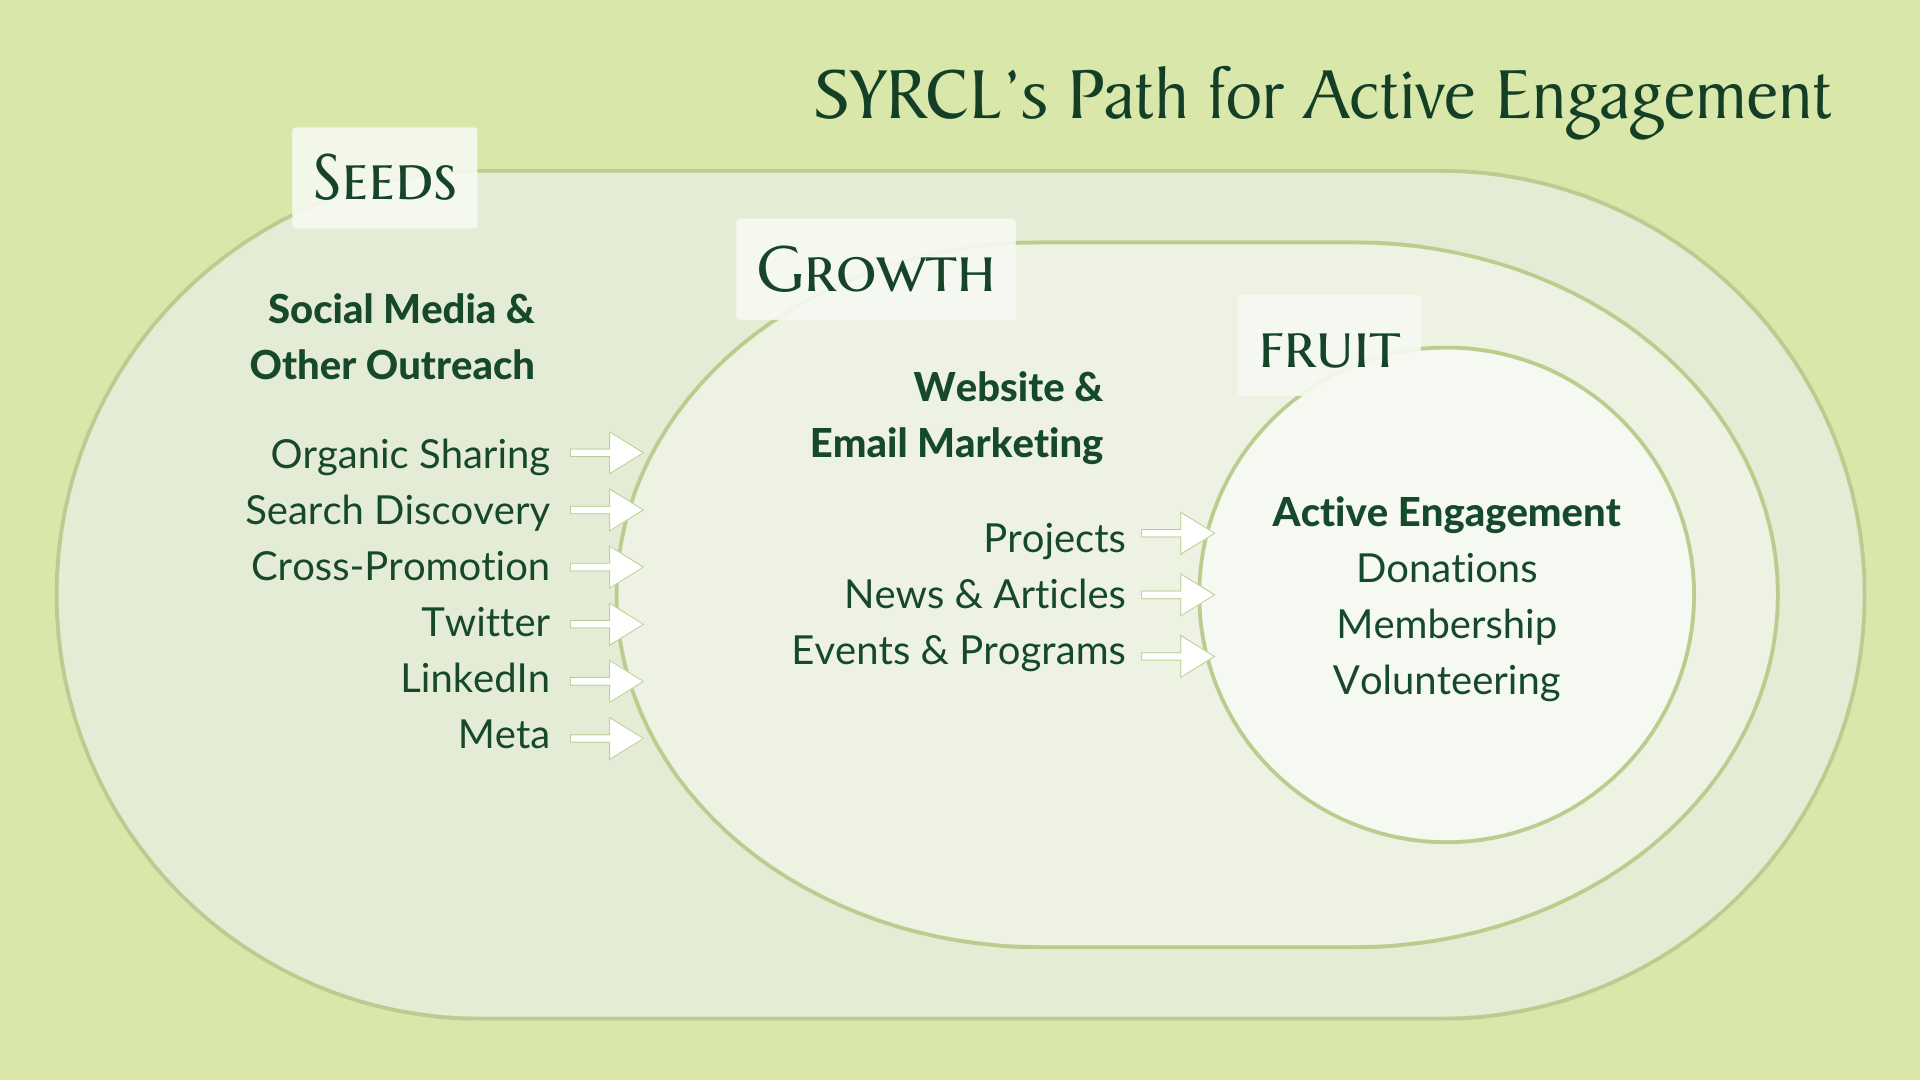
In collaboration with SYRCL's Communications Director, I worked to implement a "Pipeline to Publish" that would mirror this new Path for Active Engagement in the reverse, facilitating content development within the team and delivering value to the audience.
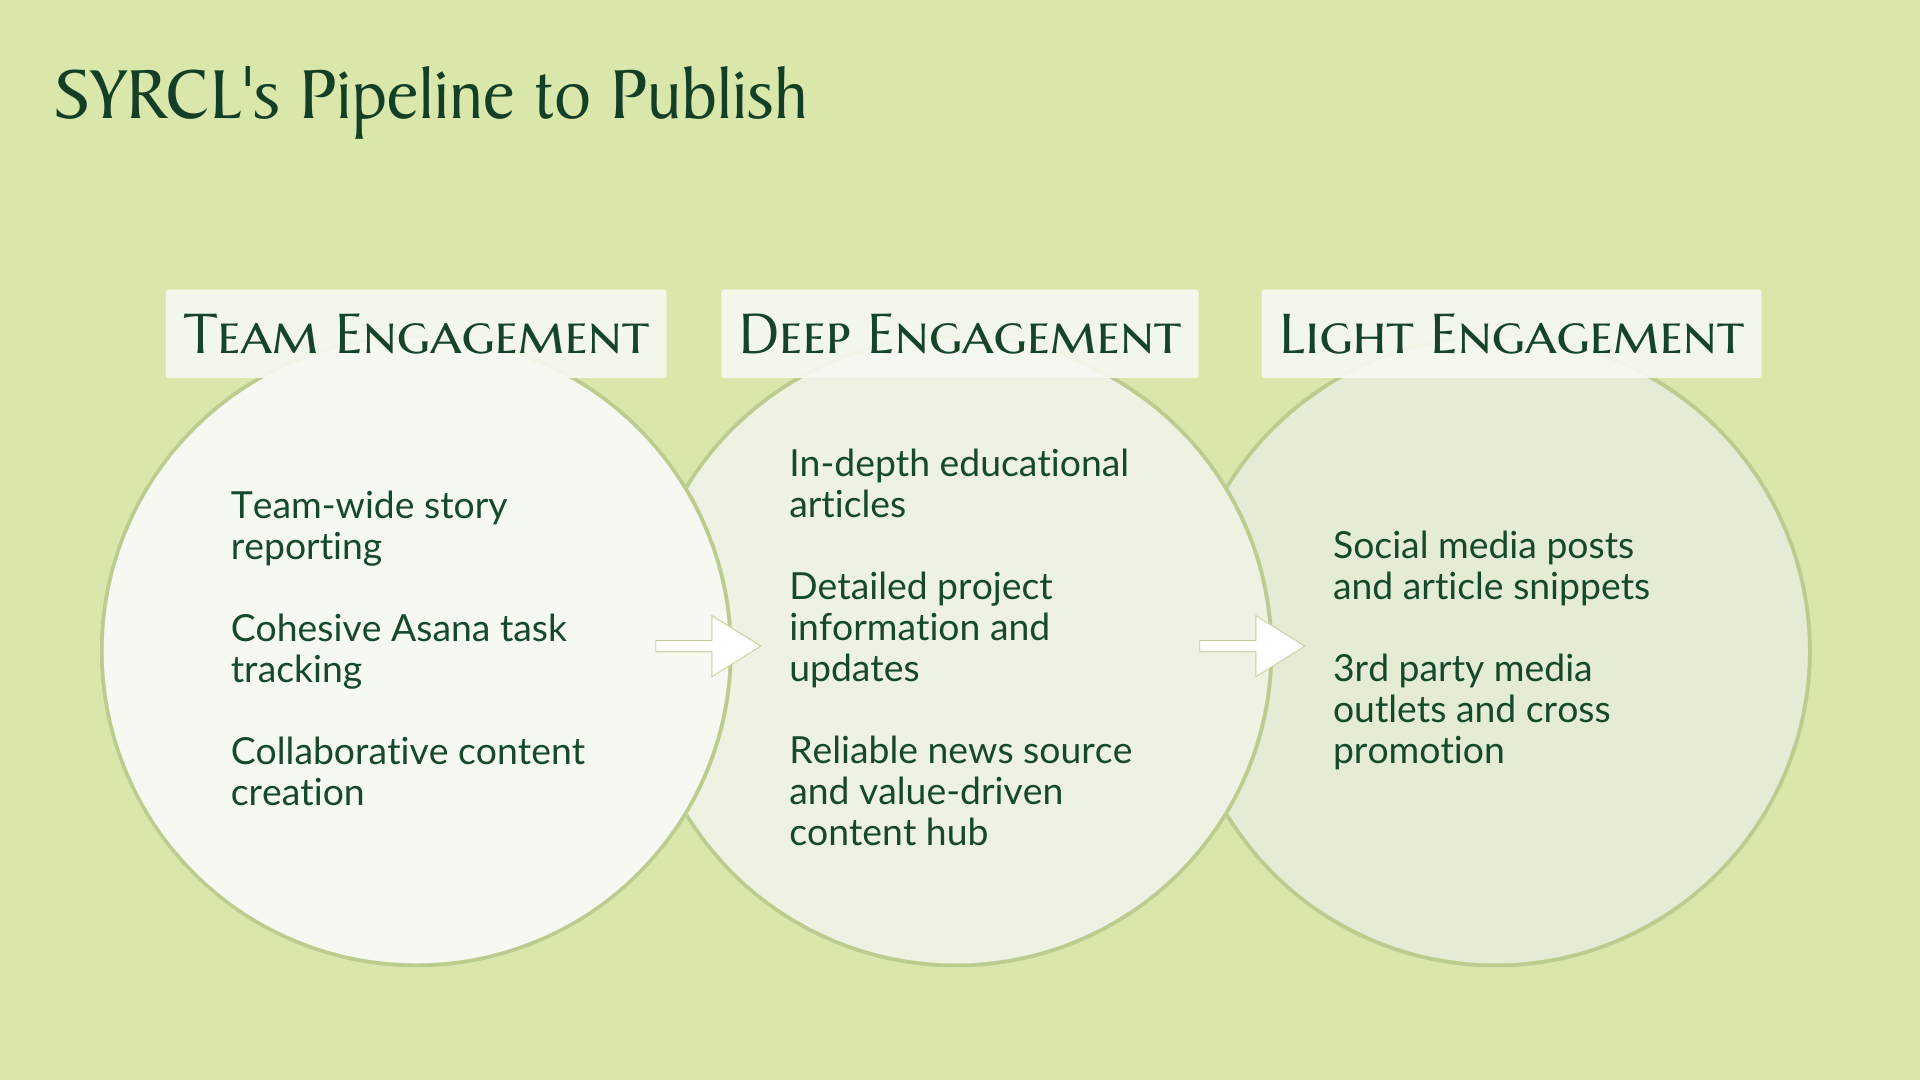
Our continued data collection demonstrated that this effectively built a bridge for users to grow from passive to active engagement through readership.
As the content strategy became more focused around audience preferences, Google Analytics provided useful insights on how users engaged with long-form content on SYRCL’s website.
This graph compares user traffic based on channel group (i.e. how they accessed the website) between Jun 28, 2023 – Sep 25, 2023 (Summer, dark blue) compared to March 22, 2023 – Jun 27, 2023 (Spring, light blue). Here we can see a noticeable increase in users visiting the website in all categories, which is great feedback.
Most notably, we see a large increase in users from “unassigned” and “referral” channels, which can be traced to SYRCL starting to use UTM linking in email newsletters and social media. We also implemented a custom link-shortener for social media posts to help make URLs easy for users type in and encourage direct traffic. For this reason, UTM parameters like Source, Medium and Campaign were not always properly configured in social posts or email marketing campaigns. (If you are using a custom naming convention for the UTM parameters, you will have a lot of unassigned traffic.)
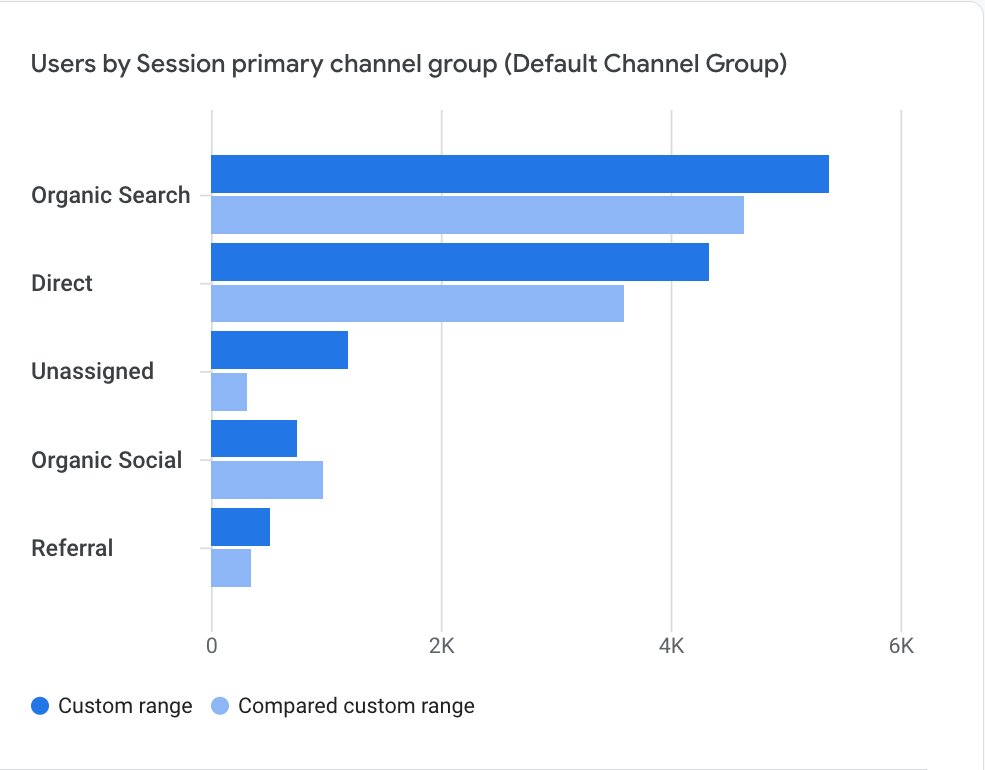
The link-shortener and UTM links created a significant change in the way traffic was being logged in Google Analytics, ultimately giving SYRCL a more accurate view of how their marketing efforts were driving traffic.
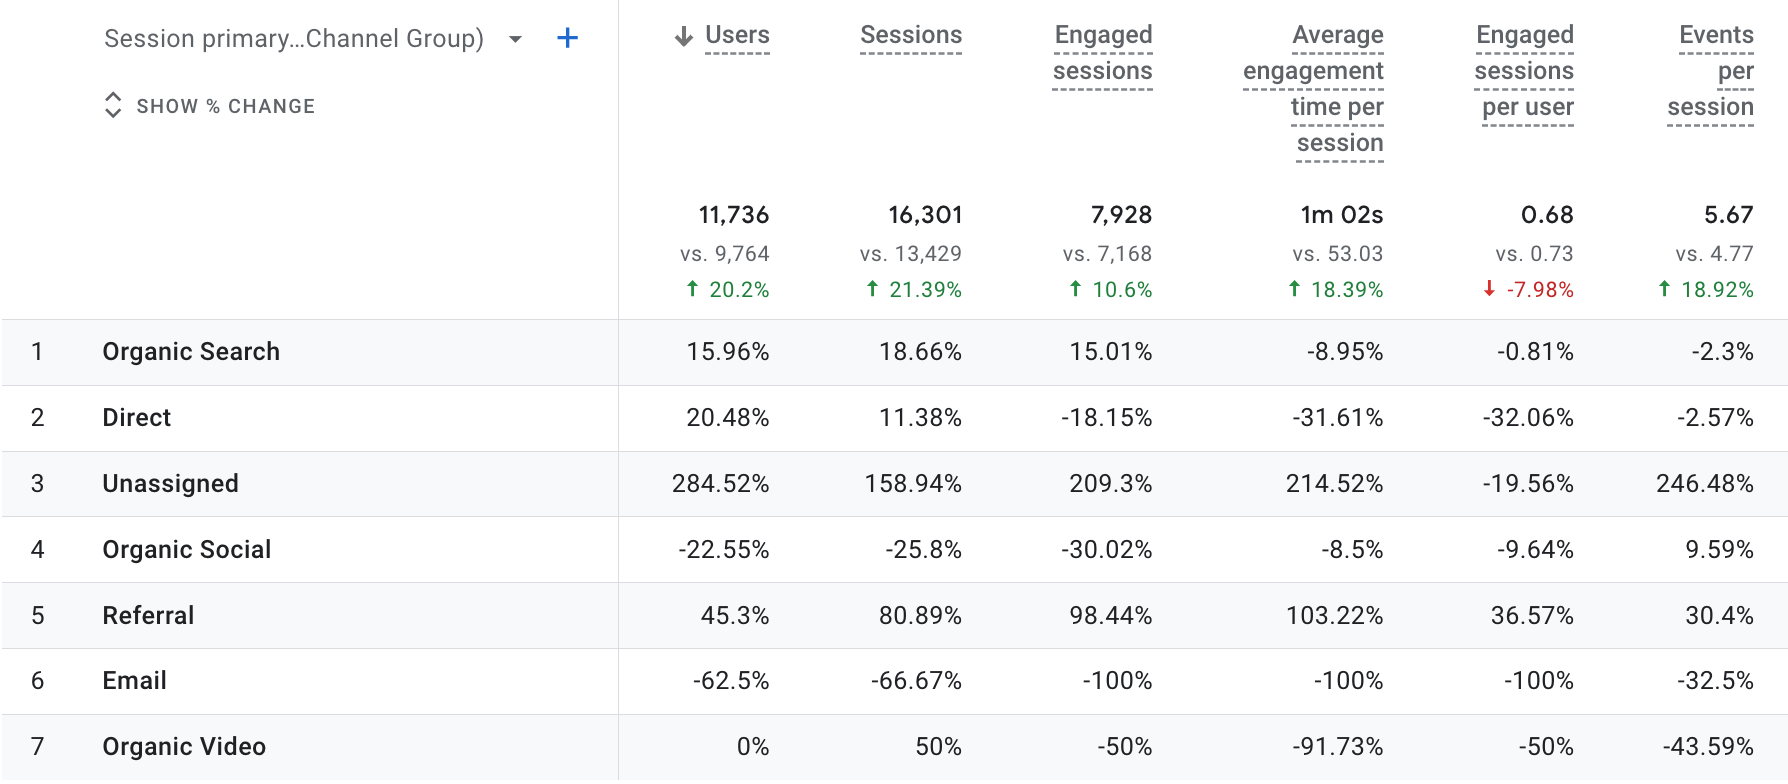
The table below shows the % change over time between Jun 28, 2023 – Sep 25, 2023 (Summer, darker, bold numbers on top) and March 22, 2023 – Jun 27, 2023 (Spring, lighter, gray numbers below), with overall higher numbers in almost all categories (except Engaged Sessions per user, which may suggest that some of the new traffic is less engaged or less-often engaged than in the previous period; it may also reflect changes in content subject matter).
The positive percentage changes are most notable for Engaged Sessions, and Average Engagement time per session, as well as for Referral and Unassigned traffic. The decrease in Organic Social and Email channels is a normal (though avoidable) outcome of this traffic being reassigned based on their UTM or short link: users are no longer clicking through social media "organically," and email clicks are no longer registered the same way when Google recognizes the custom link.
The table below compares Referral traffic to Organic Social traffic. Because many social media Referrals can be traced to the short-link forwarding used in social media posts, we again see consistent data to infer the decline in Organic Socials and significant rise in Referrals are related.


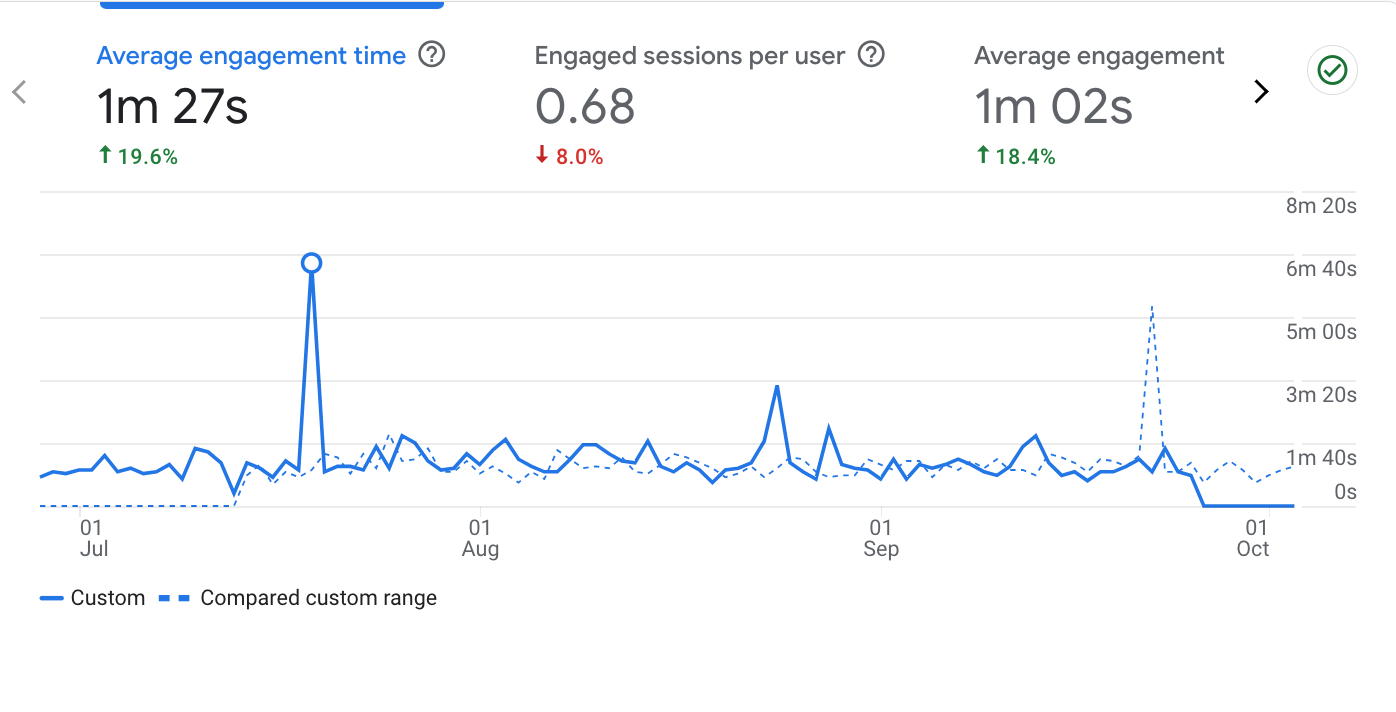
In this graphs, we can see how average User Engagement Time evolved between Jun 28, 2023 – Sep 25, 2023 (solid line) and March 22, 2023 – Jun 27, 2023 (dotted line). Generally, the website saw increases in these areas.
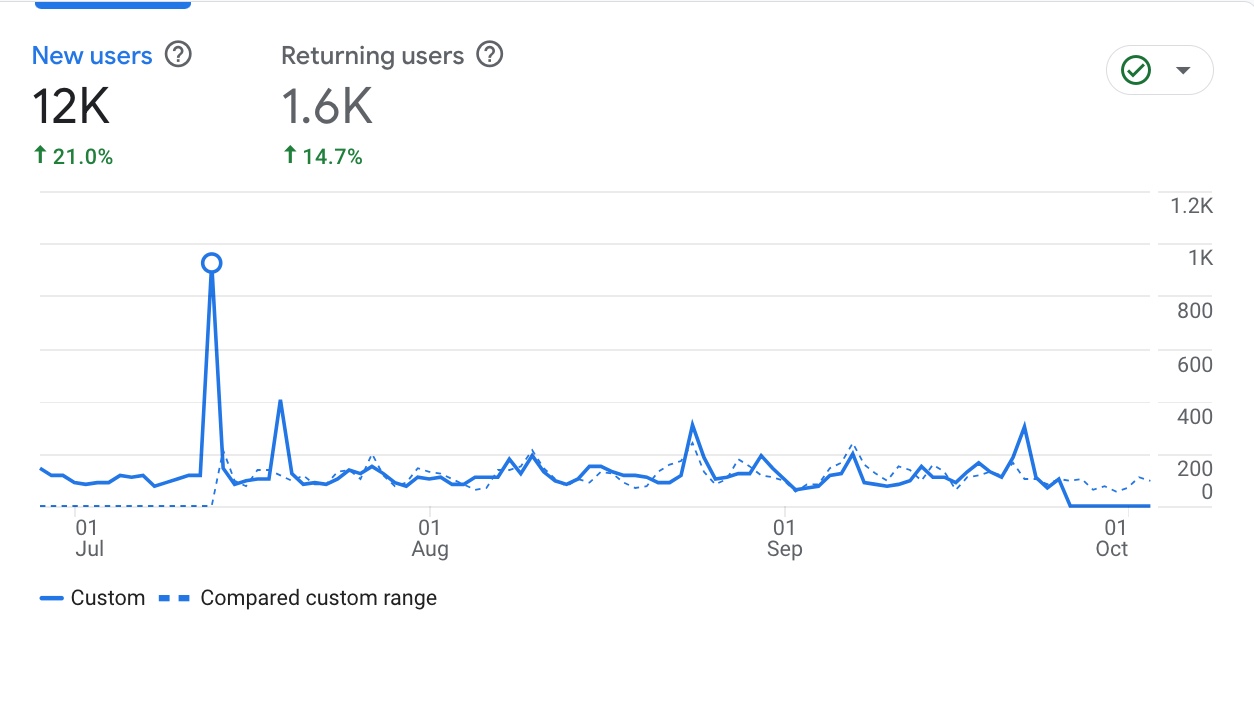
In this graphs, we can see how average User Retention evolved between Jun 28, 2023 – Sep 25, 2023 (solid line) and March 22, 2023 – Jun 27, 2023 (dotted line). Generally, the website saw increases in these areas.
I also monitored content performance on SYRCL's social media. The graphs and tables below compare performance between Jun 28, 2023 – Sep 25, 2023 (Summer) and March 22, 2023 – Jun 27, 2023 (Spring) and allow us to see how tailoring digital media towards audience interests had an impact on post performance.
sorted by Link Clicks
Facebook, being a more reading-friendly platform, lends itself better to the new readership-focused strategy for SYRCL's audience.


Building a thriving online presence goes deeper than tracking likes or counting page views – it’s about creating meaningful connections that inspire action. By focusing on metrics that reflect deep engagement and user intent, my work with brands like SYRCL shows the value of aligning content strategy with audience behavior and preferences.
When social media posts and website content work in harmony, the results can be transformative. Clear pathways for users to move from passive interaction to active participation enable organizations to foster trust, deliver value, and ultimately achieve their goals, especially with regards to driving conversions or deepening community involvement. The SYRCL case study highlights that meaningful engagement starts with understanding your audience and ends with providing them a seamless, engaging experience. Analytics, when used effectively, offer a roadmap to guide decisions, validate strategies, and refine your approach over time.
As you assess your own content performance, remember that the goal is not just growth but growth with purpose. Prioritize quality over quantity, build strategies that encourage meaningful exchanges, and ensure every piece of content you create has a clear value for your audience. By doing so, you’ll be equipped to turn insights into measurable impact and cultivate an audience that truly connects with your mission and vision, and loves to support you in your work.
